
Researchers from Alliance MBS have been analysing how COVID-19 cases have been changing nationally and locally in England since the outbreak began.
Since late January, when the first case reached England, COVID-19 has spread rapidly and widely across all local authorities.
A study by academics from within the Decision and Cognitive Sciences Research Centre (DCSRC) has shown that there have been large regional disparities in the severity of the outbreak as the epicentre has shifted from Greater London to Leicester, and then to areas across the north of England.
They also found that in those local authorities with much higher infection rates the severity of the infection has not dropped over time and instead continuously remained at a high level.
Questions
The academics say this raises questions regarding the government actions of lifting lockdown restrictions across the whole nation on 4 July with only the Leicester area being excluded.
Says report co-author Dr Yu-Wang Chen, Senior Lecturer in Decision Sciences: “At the same time the regional disparities in the risk of COVID-19 at different phases in England imply the necessity of establishing decisive and timely responses to cope with local pandemic situations.
“The wider point here is that the UK, and especially England, has been badly hit by the pandemic compared to other countries. As of mid-September there were more than 330,000 confirmed cases and 37,000 deaths in England, while data from the Office for National Statistics further shows that England has had the longest period of excess mortality rates (from all causes) in comparison with 21 European countries during the COVID-19 pandemic.”
Data
To better understand how COVID-19 has developed both nationally and locally in England, the report authors used confirmed cases data from Public Health England which reveals daily cases and infection rates per 100,000 population, and then visualised them in both graphical and geographical ways.
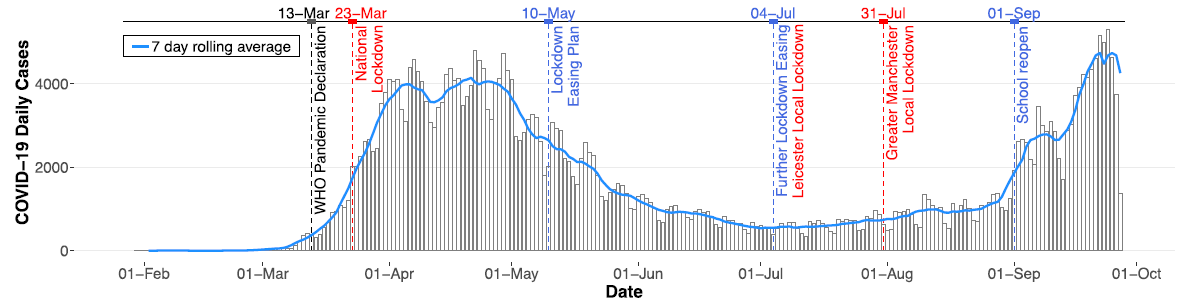
For instance the chart below detailing the daily confirmed cases of coronavirus in England shows the overall trend of the COVID-19 pandemic in England.
Findings
As part of the study the authors also summarised the regional disparities over time in the daily confirmed cases (7-day rolling average) across local authorities in England.
They did this by using cartogram maps, where the area of each local authority is scaled in proportion to its severity of the outbreak, with the area of a more severe local authority being enlarged proportionally so as to better communicate and visually emphasise the regional disparities of COVID-19 risk.
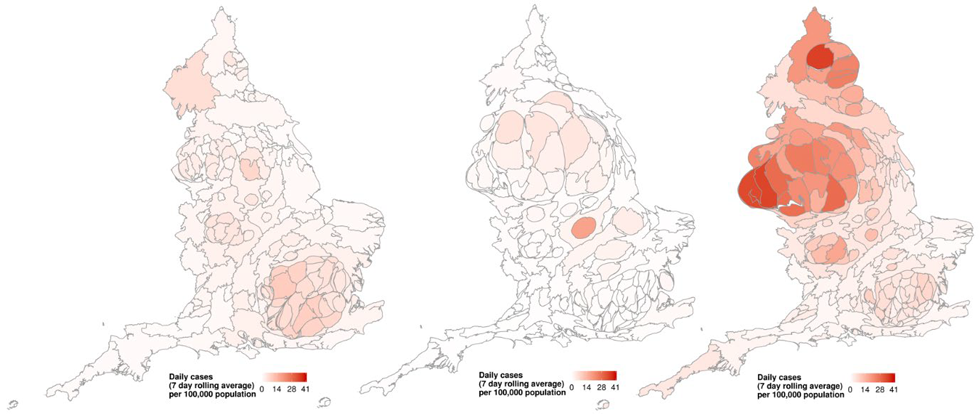
Adds Dr Chen: “The findings were three-fold. First, when the national lockdown was introduced on 23 March the pandemic was developing more rapidly within Greater London compared to other local authorities. Secondly, many local authorities saw little increase in confirmed cases (over a continuous 7-day) when lockdown restrictions were lifted on 4 July. However, there was a severe outbreak in Leicester. The coronavirus was also spreading unevenly across local authorities in the north and south of England.
“And thirdly, although local restrictions were introduced in the north-west of England from 30 July, they did not seem to improve the situation of the pandemic, with the north of England being the current epicentre in England. Also, the daily cases showed a rising trend for most of the local authorities in England during the lockdown easing phase.”
Next steps
The authors believe their work, which is supported by the Alliance MBS Strategic Investment Fund, will be of particular interest to colleagues and students, and also help raise awareness of responding to local pandemic situations responsibly.
Adds Dr Chen: “We plan to work on the report further and also update the visualisations on a weekly basis.”
The report was written by Yu-Wang Chen, Lei Ni, Dong-Ling Xu and Jian-Bo Yang.