
While many online fashion retailers have experienced huge growth during the pandemic, they are also having to contend with the ever increasing problem of high returns.
Even before the pandemic struck high returns was a problem in the industry with a quarter of all fashion goods bought online in 2019 sent back, according to the 2020 IMRG Returns Review. But since Covid-19 a study from Mintel found that almost half of UK online shoppers had sent something back in the past year, rising to 60% for those aged 16-34.
Before the pandemic, scientists at the Data Visualisation Observatory (DVO) at Alliance MBS had already begun helping the industry to better understand and map the problem.
Specifically, they partnered with Rebound Returns, a company which looks after online returns for a number of leading online fashion retailers, on a project which clustered customers according to their spending behaviour and profitability for retailers. It then mapped that information with specific data around their returns behaviour and also overlaid demographics such as the customer’s gender to build up a detailed dataset.
Persistent problem
Professor Nikolay Mehandjiev from the DVO explains the background to the project. “We began working on this project before lockdowns were first introduced last year, lockdowns which have only further driven the growth of returns in online fashion. Rebound Returns was keen for us to analyse the problem in greater depth in order to help create solutions, as the habit of returning goods ultimately costs retailers a lot of money. Retailers were also interested in exploring how they could also stop people from returning goods in the first place.”
Sam Sahana, Chief Technical Officer and Board Director at Rebound Returns, who is also an Executive MBA alumnus of AMBS, said the project had proved invaluable in terms of mapping the problem and designing possible solutions to tackling it.
“As we expected our study showed that young women in particular are particularly prone to returning goods, while it also showed how expensive items are not returned that much. We can also identify ‘renters’ who return the majority of their purchases after wearing them a couple of times, and the effect of lockdowns and sales on return rates.
“Now that we have built up this dataset we can begin to look at whether we can start to introduce specific return conditions for certain customers, and also at whether we can introduce different penalty terms for those who persistently return goods.”
Datasets
The resulting 3D images show how the DVO allows users to easily generate a variety of 3D views of their research datasets. Specifically, the user works with the DVO portal to define how the results of analysing their dataset should be presented in a 3D space, without having to program at any point of the process.
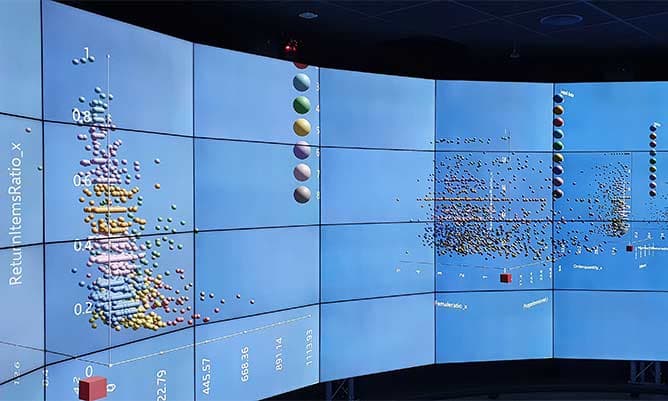
After sending their data to the DVO portal the user is issued a QR code by the system and this is their ‘ticket’ which can be scanned upon arriving in the observatory. This automatically retrieves the data and visualises the analytic results in a set of interlinked 3D charts.
Added Professor Nikolay Mehandjiev: “This platform is of use for anyone who wants to visualise a complex data set, so we expect it to be of particular interest across many different sectors. The idea is very much that we take all the hassle away from the user and after loading the data we can do the rest. What is also shows is that some data only truly make sense when you see it represented in 3D.”