
Bigger picture
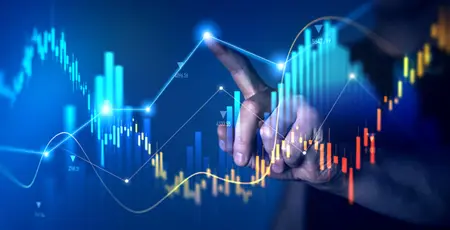
The AMBS Data Visualisation Observatory is developing new data models for organisations.
Our Data Visualisation Observatory is helping develop new data models for a range of organisations and businesses.
While many online fashion retailers have experienced huge growth during the pandemic, they are also having to contend with the ever increasing problem of high returns.
Before the pandemic, scientists at the Observatory had already begun helping the industry to better understand and map the problem. Specifically, they partnered with Rebound Returns, a company which looks after online returns for a number of leading online fashion retailers, on a project which clustered customers according to their spending behaviour and profitability for retailers. It then mapped that information with specific data around their returns behaviour and also overlaid demographics such as the customer's gender to build up a detailed dataset.
Creating solutions
Professor Nikolay Mehandjiev from the Observatory explains the background to the project. "We began working on this project before lockdowns were first introduced last year, lockdowns which have only further driven the growth of returns in online fashion. Rebound Returns was keen for us to analyse the problem in greater depth in order to help create solutions, as the habit of returning goods ultimately costs retailers a lot of money. Retailers were also interested in exploring how they could also stop people from returning goods in the first place."
Sam Sahana, Chief Technical Officer and Board Director at Rebound Returns, who is also an Executive MBA alumnus of Alliance MBS, said the project had proved invaluable in terms of mapping the problem and designing possible solutions to tackling it.
"As we expected our study showed that young women in particular are particularly prone to returning goods, while it also showed how expensive items are not returned that much. We could also identify ‘renters’ who return the majority of their purchases after wearing them a couple of times, and the effect of lockdowns and sales on return rates.
"Now that we have built up this dataset we can begin to look at whether we can start to introduce specific return conditions for certain customers, and also at whether we can introduce different penalty terms for those who persistently return goods."
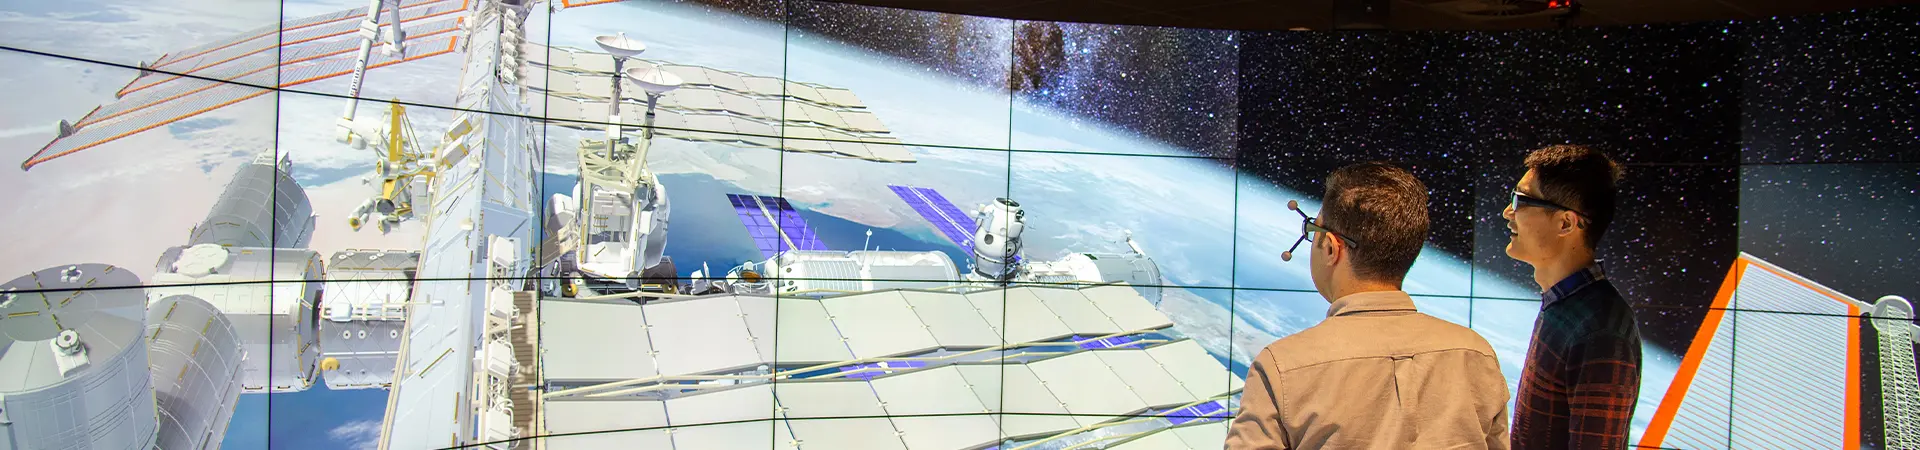
The resulting 3D images show how the Observatory allows users to easily generate a variety of 3D views of their research datasets.
Research datasets
The resulting 3D images show how the Observatory allows users to easily generate a variety of 3D views of their research datasets. Specifically, the user works with the Observatory portal to define how the results of analysing their dataset should be presented in a 3D space, without having to programme at any point of the process.
After sending their data to the Observatory portal the user is issued a QR code by the system and this is their ‘ticket’ which can be scanned upon arriving in the Observatory. This automatically retrieves the data and visualises the analytic results in a set of interlinked 3D charts.
Added Professor Mehandjiev: “This platform is of use for anyone who wants to visualise a complex data set, so we expect it to be of particular interest across many different sectors. The idea is very much that we take all the hassle away from the user and after loading the data we can do the rest. What is also shows is that some data only truly make sense when you see it represented in 3D."
VR environment
Meanwhile, leading retailers are being given the opportunity to use the Observatory to analyse consumer perceptions and purchase behaviour in a virtual reality (VR) environment.
The Observatory has set up an immersive virtual reality simulation of a supermarket which can track how consumers interact within a specific retail environment in real-time.
The big benefit of the system for users is the ability to conduct research in a controlled environment which they define themselves. They can also conduct repeat experiments using different store layouts and monitor consumer behaviours, while the platform can also facilitate further data analysis options using AI and data mining algorithms.
Tracking COVID-19 levels
The Observatory recently launched a platform that enables users to track COVID-19 levels across Greater Manchester.
The Greater Manchester Digital Twin model is an immersive 320 degree 3D virtual reality simulation of the city that can superimpose a variety of datasets depending on exactly what information the viewer wants to see.
Data scientists at Alliance MBS have created a programme using geographic heat maps and 3D bar charts which enables decision-makers and the public to see how levels of COVID-19 infections have changed across different parts of the city over time and possible contagion paths.
They believe the platform could have significant benefits for a number of health organisations and government bodies, especially as it links a number of diverse datasets such as multiple deprivation indices, air pollution, and local amenities such as schools and hospitals. Mixing such data could, for instance, help city health chiefs gain a better understanding of why specific areas of the city might be more prone to higher levels of infections than others.
Such is the potential of the software that a collaboration between the School of Health Sciences at The University of Manchester and Alliance MBS has now been launched to explore the opportunities for impact and research arising out of the platform for current epidemiological research.
Dr Qudamah Quboa, Research Associate at the Observatory, said: "The beauty of the platform is that you can bring together a number of different metrics, whether that’s COVID-19 infections, traffic and pollution levels, deprivation indicators, house prices, or crime statistics.
"In terms of COVID-19 we think the platform could potentially be very useful for anyone tracking infection levels across the city region from one week to the next. A heat map enables you to see where the infections are highest, and you can also drill down to see how different factors might be leading to the spread of infections, such as maybe the presence of a large secondary school in a specific area."
Potential
Dr Quboa added that the Observatory also had the potential to recreate such a city simulation for virtually any location. "In theory we can create these maps for virtually every city in the world."
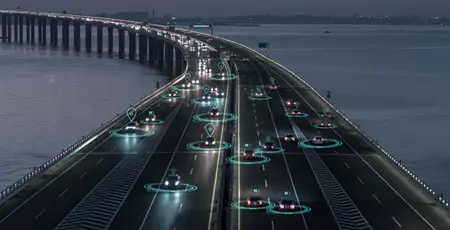
The platform can also be used for a vast range of other applications. As he added: "For instance, one could also superimpose on the map NO₂ emission data from publicly available sensors so that you can see levels of air pollution across the city. Traffic flows across the city using real traffic datasets could also be added to help transport chiefs monitor traffic levels at peak times, and link flows with real-time air quality." The map can also be superimposed with indices such as house prices and land value datasets, and can also be of use to anyone looking to construct a new building.
BBC film
The Observatory was also recently featured in a BBC film to support a unique experiment on immunity in the fight against COVID-19.
In The Truth about Boosting your Immune System Professor Sheena Cruickshank, The University of Manchester's academic lead for Public Engagement with Research and an immunologist, appeared alongside presenter Dr Ronx Ikharia, an emergency medicine doctor.
In the programme, a segment of which was filmed at Alliance MBS, they recruited a group of volunteers with busy lifestyles and gave them an ‘immune makeover' by changing their diet, exercise and sleep habits for six weeks in order to test the impact on their immune health.
It's an example of how the Observatory allows users to visualise raw high-quality images using an immersive environment. For instance the visualisation package is also of particular use to cultural institutions wishing to digitise collections, and facilitates the viewing of any high-quality image by curving the image according to the 320 degree arc of the Observatory.